This week’s case is a 61-year-old man who was treated surgically for colon cancer 9 months ago. Normal CT at that time.
1. Liver metastasis
2. Nodular fatty infiltration of the liver
3. Hepatocellular carcinoma
4. None of the above
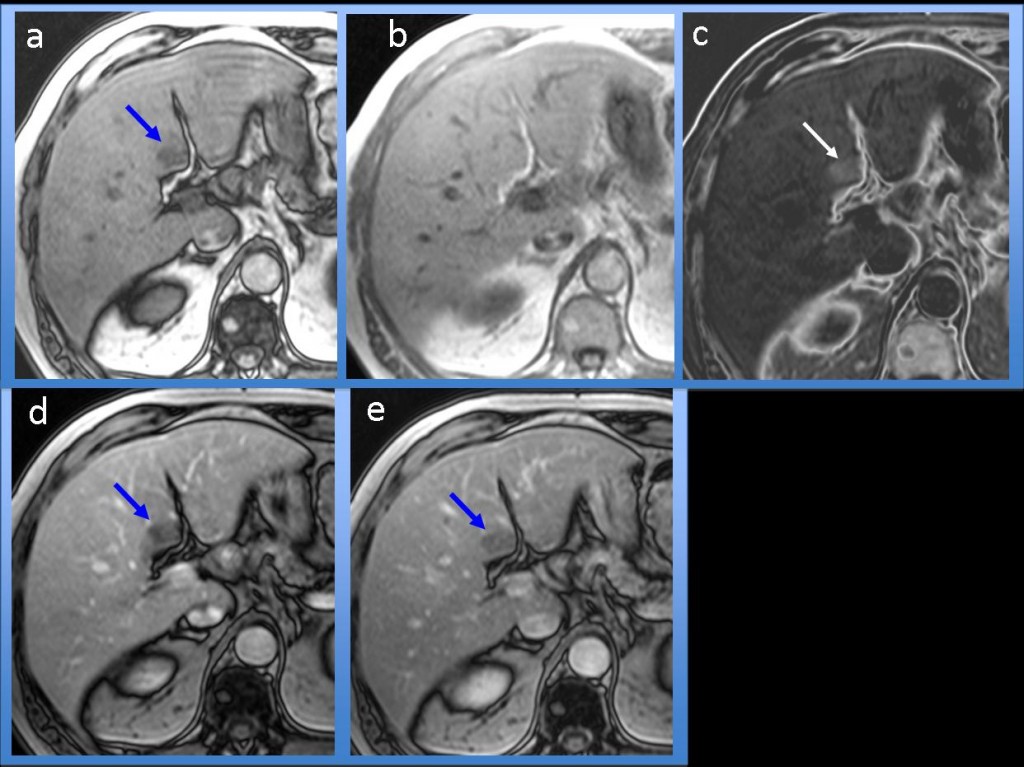
Findings: (a) Opposed-phase (OP) T1-w gradient-echo (GE) image of the liver shows a hypointense nodule in seg. IV (arrow). (b) On in-phase (IP) T1-w GE image, the nodule is not seen because it is isointense to the liver parenchyma. (c) The nodule is hyperintense on IP-OP subtraction image (arrow). (d) On Gd-enhanced OP arterial phase, the nodule is hypovascular and (e) no capsule is seen on OP venous phase image (arrows).
Final diagnosis: Nodular focal fatty infiltration of the liver.

Fig. 2
On CT studies, nodular focal fatty infiltration of the liver is difficult to diagnose because the amount of fat usually does not suffice to reach CT density values (-90 HU); thus it mimics other, non-fatty liver lesions. However, the diagnosis can be easily reached using a chemical-shift T1-w GE MR imaging technique, which is based on the difference in resonance frequency of water and fat protons (OP and IP images). This technique enables accurate differentiation between liver nodules with a fatty component and others without fat. Nodules comprised of a mixture of water and fat show notable signal intensity (SI) loss on OP images compared with the SI on IP images, whereas in lesions without fatty component, the SI is the same on both OP and IP images.
Additionally, IP and OP images can be subtracted, and this capability is also useful for differentiating between lesions with and without fat. Whereas fatty lesions show high SI on IP-OP subtraction images, lesions without fat show a complete absence of SI.
Chemical-shift imaging: Findings in a lesion without fatty component

Fig. 3
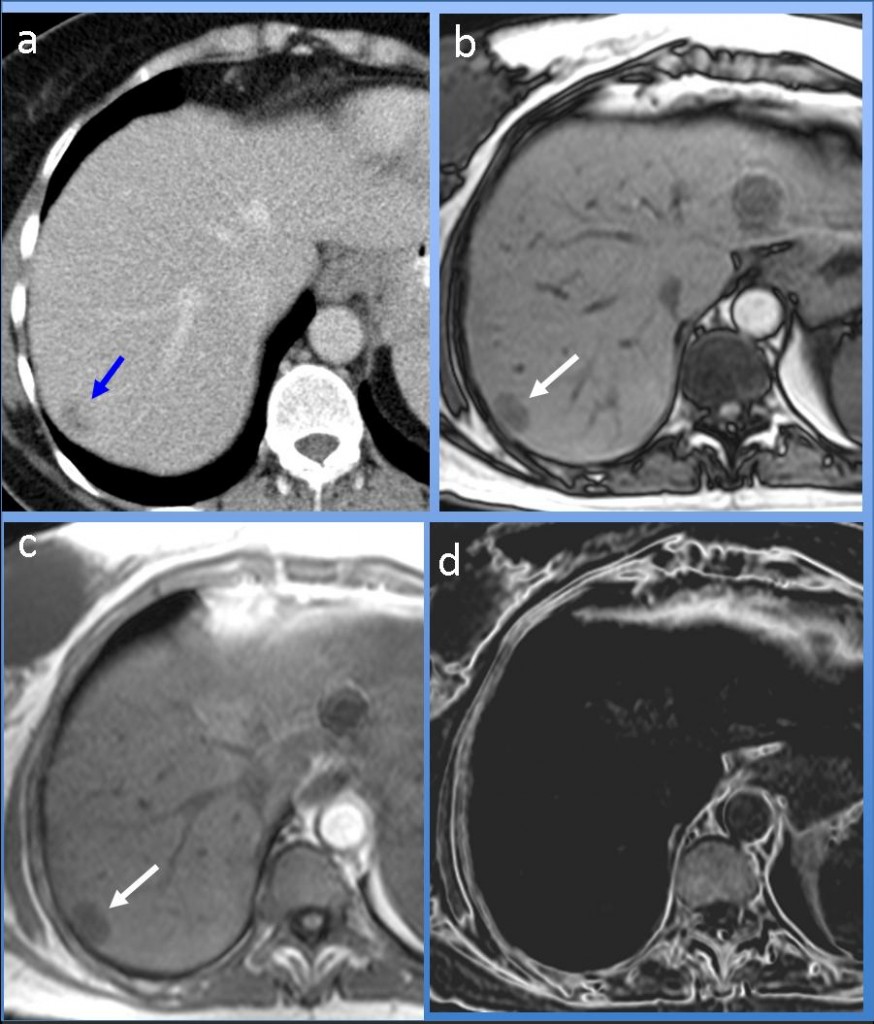
Chemical-shift imaging in one case of liver lesions without fat: (a) On CT study, a hypodense nodule is seen in seg. VII (arrow). The SI of the nodule is the same in both OP (b) and IP (c) T1-w GE images (arrows), thus confirming the absence of fatty component in the nodule. (d) In the IP-OP subtraction image, the lesion shows total absence of signal intensity because there is no difference in SI between the IP and OP images.
Diagnosis: Liver metastasis
The differential diagnosis of nodular focal fatty infiltration of the liver includes other nodules that can have fatty component, like angiomyolipoma (AML), hepatocellular adenoma (HA) or hepatocellular carcinoma (HCC). AML, HA, and HCC are usually hypervascular lesions, in contrast to nodular fatty infiltration, which is not hypervascular. In addition, HA and HCC usually have a peripheral capsule, whereas fatty infiltration of the liver never has a capsule.

Fig. 4
Chemical-shift imaging in a case of hepatocellular carcinoma with fat. (a) OP T1-w GE image shows a hypointense nodule in seg. VII (arrow). (b) The nodule is almost imperceptible in the IP T1-w GE image. (c) On arterial phase Gd-enhanced OP T1-w imaging, the lesion is hypervascular (arrow). (d) A thin peripheral capsule is seen in the venous phase OP image (arrow).

Fig. 5
Chemical-shift imaging in a case of hepatocellular adenoma with fat. (a) OP T1-w GE image shows a hypointense nodule in seg. IV (arrow). (b) The nodule is almost isointense and is imperceptible in the IP T1-w GE image. (c) On arterial phase Gd-enhanced OP T1-w imaging, the lesion is hypervascular (arrow). (d) A nice peripheral capsule (arrow) is seen in the venous phase OP image.

Follow Dr. Pepe’s advice
Follow Dr. Pepe’s advice:
- Chemical-shift MR imaging differentiates between liver lesions with or without a fatty component. In lesions with a fatty component, there is a notable difference in SI between OP and IP images, whereas in lesions without fat, SI is the same on both OP and IP images.
- In IP-OP subtraction images, nodules with fat show a high SI and those without fat show absence of SI.
- Aside from nodular fatty infiltration of the liver, other liver lesions like AML, HA or HCC may contain fat. In these cases, the presence of a capsule or a high SI on Gd-enhanced arterial phase images helps to suggest the diagnosis.
References
- Martin J, Sentis M, Puig J et al. Comparison of In-phase and Opposed-Phase GRE and conventional SE MR pulse sequences
in T1-weighted imaging of liver lesions. J Comput Assist Tomogr 1996 Nov-Dec; 20 (6). 890-7
- Merkle EM, Nelson RC. Dual Gradient-Echo In-Phase and Opposed-Phase Hepatic MR Imaging: A useful Tool for Evaluating
More Than Fatty Infiltration or Fatty Sparing. Radiographics 2006;26:1409-1418
Case prepared by Julio Martin MD